We want to hear from you! Help us gain insights into the state of the Ansible ecosystem.
Take the Ansible Project Survey 2024

Getting Started With Ansible Content Collections

Getting Started With Ansible Content Collections

With the release of Red Hat Ansible Automation Platform, Ansible Content Collections are now fully supported. Ansible Content Collections, or collections, represent the new standard of distributing, maintaining and consuming automation. By combining multiple types of Ansible content (playbooks, roles, modules, and plugins), flexibility and scalability are greatly improved.

Who Benefits?

Everyone!

Traditionally, module creators have had to wait for their modules to be marked for inclusion in an upcoming Ansible release or had to add them to roles, which made consumption and management more difficult. By shipping modules within Ansible Content Collections along with pertinent roles and documentation, and removing the barrier to entry, creators are now able to move as fast as the demand for their creations. For a public cloud provider, this means new functionality of an existing service or a new service altogether, can be rolled out along with the ability to automate the new functionality.

For the automation consumer, this means that fresh content is continuously made available for consumption. Managing content in this manner also becomes easier as modules, plugins, roles, and docs are packaged and tagged with a collection version. Modules can be updated, renamed, improved upon; roles can be updated to reflect changes in module interaction; docs can be regenerated to reflect the edits and all are packaged and tagged together. 

On top of this, before collections, it was not uncommon for modules to break or lack timely updates needed to interact with the services they were interfacing with. This often required Ansible users or Ansible Tower administrators to run multiple versions of Ansible in virtual environments in order to consume a patch that addressed a module issue. Ansible Content Collections bring stability and predictability by breaking modules out from the core distribution.

For automated organizations, this means that certified content is readily available to be applied to use-cases ripe for automation from day one.

Where to Find Collections

With the launch of Red Hat Ansible Automation Platform, Automation Hub will be the source for certified collections. Additionally, collections creators can also package and distribute content on Ansible Galaxy. Ultimately, it is up to the creator to decide the delivery mechanism for their content, with Automation Hub being the only source for Red Hat Certified Collections.

A Closer Look at Collections

An Ansible Content Collection can be described as a package format for Ansible content:

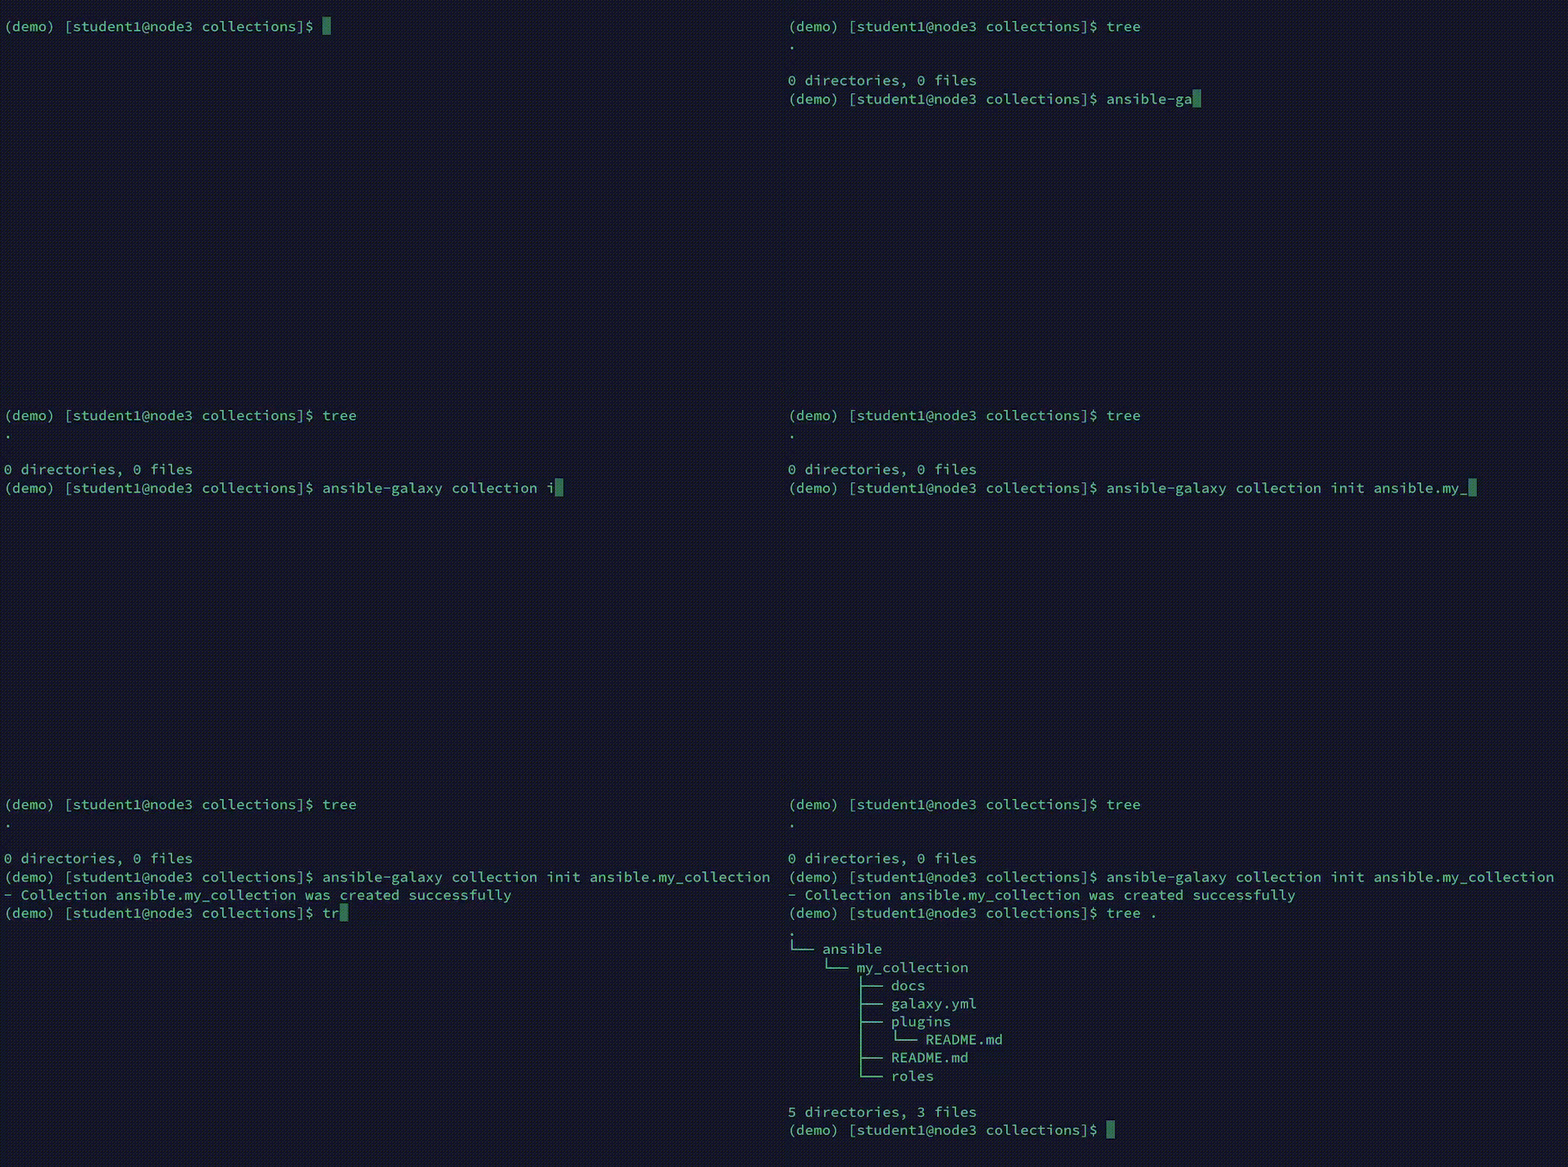
example collection filesystem

This format has a simple, predictable data structure, with a straightforward definition:

  • docs/: local documentation for the collection
  • galaxy.yml: source data for the MANIFEST.json that will be part of the collection package
  • playbooks/: playbooks reside here 
    • tasks/: this holds 'task list files' for include_tasks/import_tasks usage
  • plugins/: all ansible plugins and modules go here, each in its own subdir
  • roles/: directory for ansible roles
  • tests/: tests for the collection's content

More information regarding collection metadata

Interacting with Collections

In addition to downloading collections through the browser, the ansible-galaxy command line utility has been updated to manage collections, providing much of the same functionality as has always been present to manage, create and consume roles. For example, ansible-galaxy collection init can be used to create a starting point for a new user created collection.

galaxy collection init example

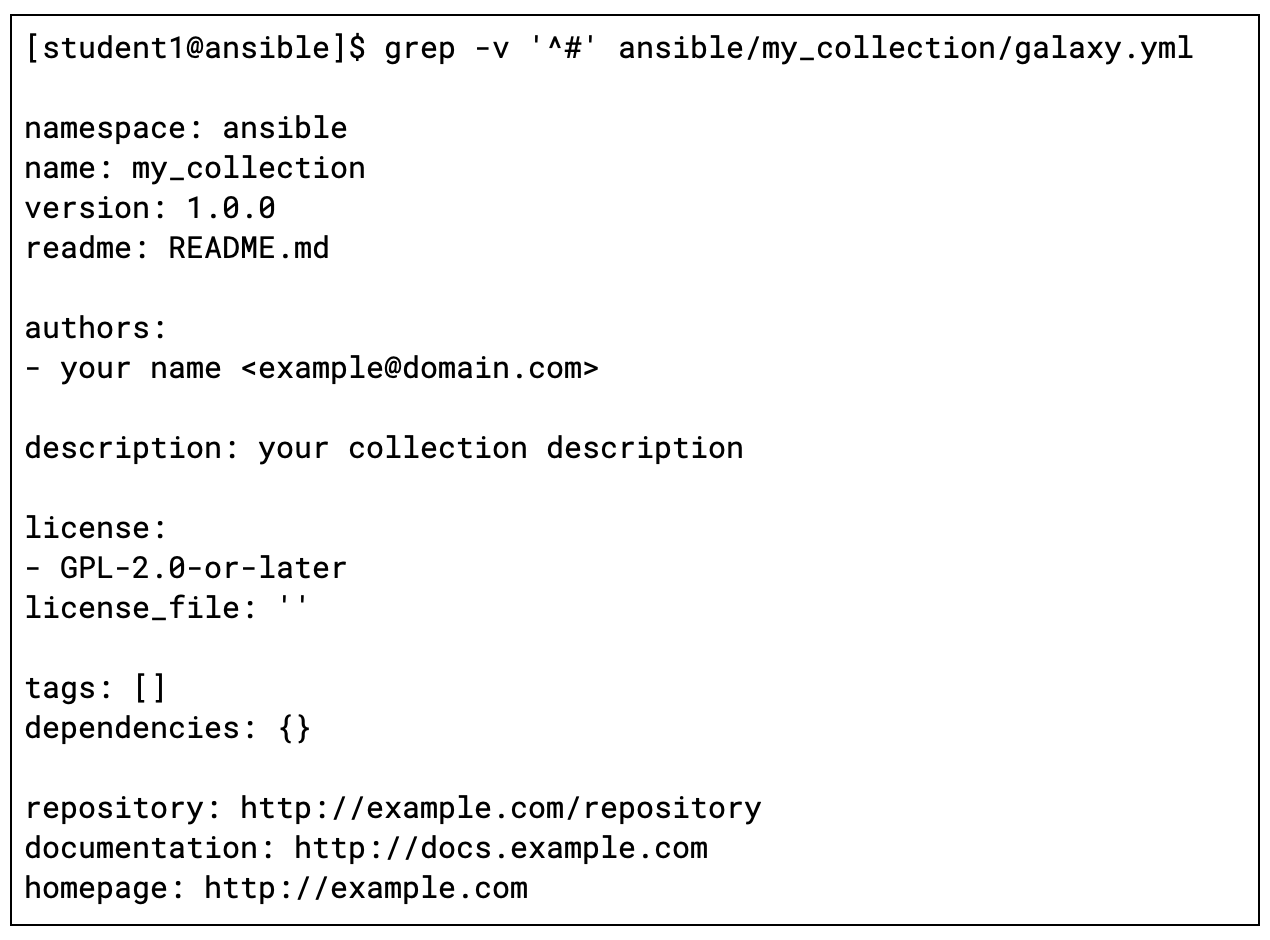
Along with the correct directory structure to start creating a collection from, this command also generates a metadata file that will be used while building the collection with namespace and collection name pre-populated:

example galaxy metadata

Where to Go Next

Ansible Content Collections were first introduced as tech preview in Ansible Engine 2.8 and are now fully supported in Ansible Engine 2.9 and are an integral part of Red Hat Ansible Automation Platform. Collections allow Red Hat Ansible Automation Platform to offer certified, stable content in order to continue expanding use cases for automation. Future posts will dive deeper into developing new collections and converting existing roles into collections.


Ansible and ServiceNow Part 3, Making outbound RESTful API calls to Red Hat Ansible Tower

Ansible and ServiceNow Part 3, Making outbound RESTful API calls to Red Hat Ansible Tower

Red Hat Ansible Tower offers value by allowing automation to scale in a checked manner - users can run playbooks for only the processes and targets they need access to, and no further. 

Not only does Ansible Tower provide automation at scale, but it also integrates with several external platforms. In many cases, this means that users can use the interface they are accustomed to while launching Ansible Tower templates in the background. 

One of the most ubiquitous self service platforms in use today is ServiceNow, and many of the enterprise conversations had with Ansible Tower customers focus on ServiceNow integration. With this in mind, this blog entry walks through the steps to set up your ServiceNow instance to make outbound RESTful API calls into Ansible Tower, using OAuth2 authentication.

The following software versions are used:

  • Ansible Tower: 3.4, 3.5
  • ServiceNow: London, Madrid

If you sign up for a ServiceNow Developer account, ServiceNow offers a free instance that can be used for replicating and testing this functionality. Your ServiceNow instance needs to be able to reach your Ansible Tower instance. Additionally, you can visit https://ansible.com/license to obtain a trial license for Ansible Tower. Instructions for installing Ansible Tower can be found here

Preparing Ansible Tower

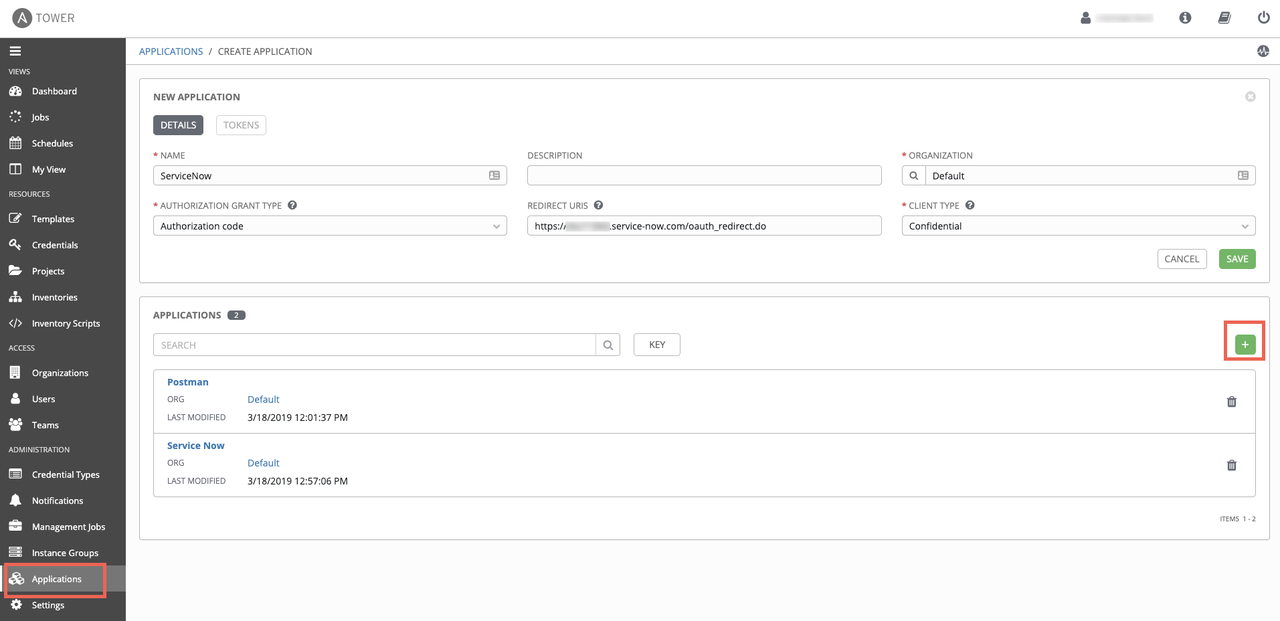
  1. In Ansible Tower, navigate to Applications on the left side of the screen. Click the green plus button on the right, which will present you with a Create Application dialog screen. Fill in the following fields:

  2. Name: Descriptive name of the application that will contact Ansible Tower

  3. Organization: The organization you wish this application to be a part of
  4. Authorization Grant Type: Authorization code
  5. Redirect URIS: https://<snow_instance_id>.service-now.com/oauth_redirect.do
  6. Client Type: Confidential

    image3-4

  7. Click the green Save button on the right, at which point a window will pop up, presenting you with the Client ID and Client Secret needed for ServiceNow to make API calls into Ansible Tower. This will only be presented ONCE, so capture these values for later use.

    image18

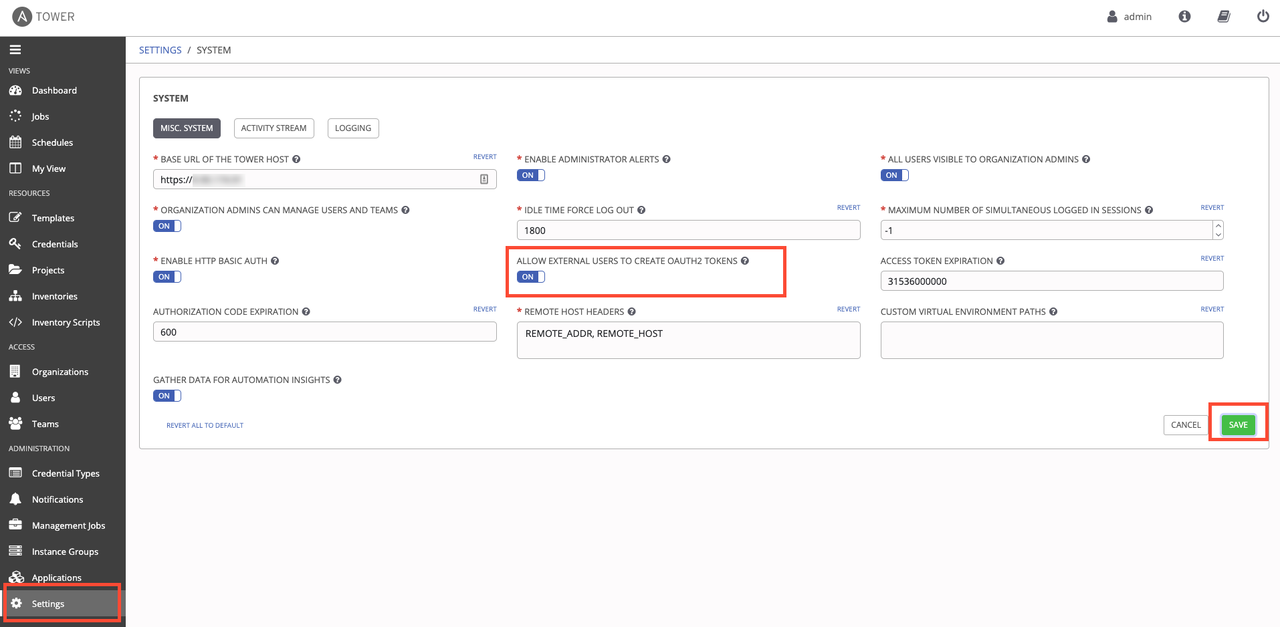
  8. Next, navigate to Settings->System on the left side of the screen. You'll want to toggle the Allow External Users to Create Oauth2 Tokens option to on. Click the green Save button to commit the change.

    image4-4

Preparing ServiceNow

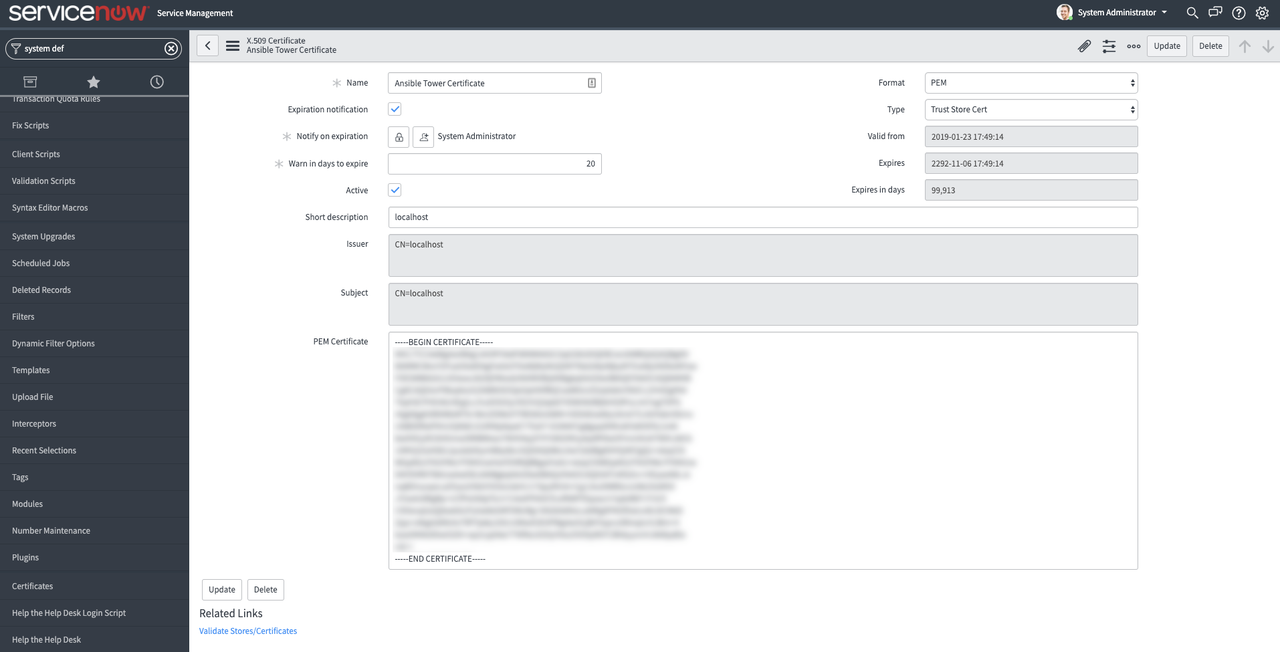
  1. Moving over to ServiceNow, Navigate to System Definition->Certificates. This will take you to a screen of all the certificates Service Now uses. Click on the blue New button, and fill in these details:

  2. Name: Descriptive name of the certificate

  3. Format: PEM
  4. Type: Trust Store Cert
  5. PEM Certificate: The certificate to authenticate against Ansible Tower with. You can use the built-in certificate on your Tower server, located at /etc/tower/tower.cert. Copy the contents of this file into the field in ServiceNow.

    Click the Submit button at the bottom.

    image9-1

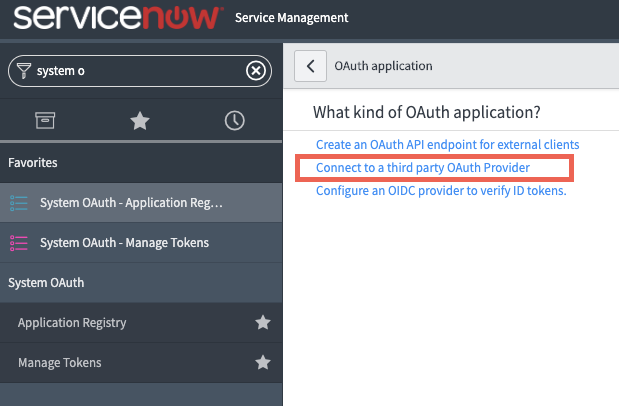
  6. In ServiceNow, Navigate to System OAuth->Application Registry. This will take you to a screen of all the Applications ServiceNow communicates with. Click on the blue New button, and you will be asked What kind of Oauth application you want to set up. Select Connect to a third party Oauth Provider.

    image20

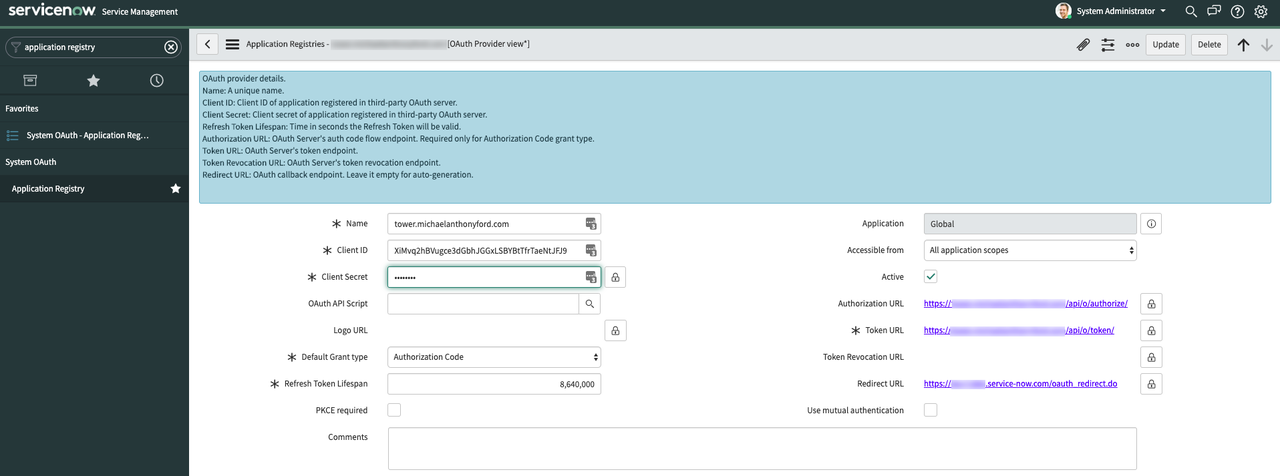
  7. On the new application screen, fill in these details:

  8. Name: Descriptive Application Name

  9. Client ID: The Client ID you got from Ansible Tower
  10. Client Secret: The Client Secret you got from Ansible Tower
  11. Default Grant Type: Authorization Code
  12. Authorization URL: https://<tower_url>/api/o/authorize/
  13. Token URL: https://<tower_url>/api/o/token/
  14. Redirect URL: https://<snow_instance_id>.service-now.com/oauth_redirect.do

    Click the Submit button at the bottom.

    image19

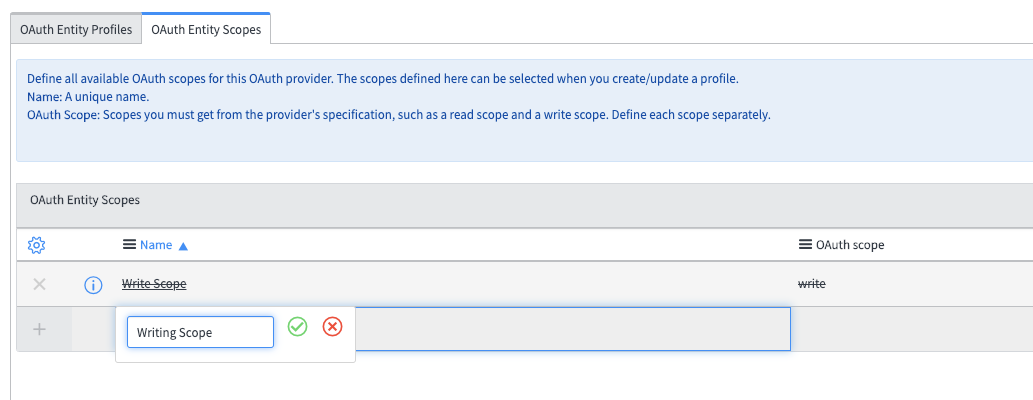
  15. You should be taken out to the list of all Application Registries. Click back into the Application you just created. At the bottom, there should be two tabs: Click on the tab Oauth Entity Scopes. Under here, there is a section called Insert a new row.... Double click here, and fill in the field to say Writing Scope. Click on the green check mark to confirm this change. Then, right-click inside the grey area at the top where it says Application Registries and click Save in the menu that pops up.

    image11-1

  16. The writing scope should now be Clickable. Click on it, and in the dialog window that you are taken to, type write in the Oauth scope box. Click the Update button at the bottom.

    image7-1

  17. Back in the Application Settings page, scroll back to the bottom and click the Oauth Entity Profiles tab. There should be an entity profile populated - click into it.

    image21

  18. You will be taken to the Oauth Entity Profile Window. At the bottom, Type Writing Scope into the Oauth Entity Scope field. Click the green check mark and update.

    image23

  19. Navigate to System Web Services -> REST Messages. Click the blue New button. In the resulting dialog window, fill in the following fields:

  20. Name: Descriptive REST Message Name

  21. Endpoint: The url endpoint of the Ansible Tower action you wish to do. This can be taken from the browsable API at https://<tower_url>/api
  22. Authentication Type: Oauth 2.0
  23. Oauth Profile: Select the Oauth profile you created

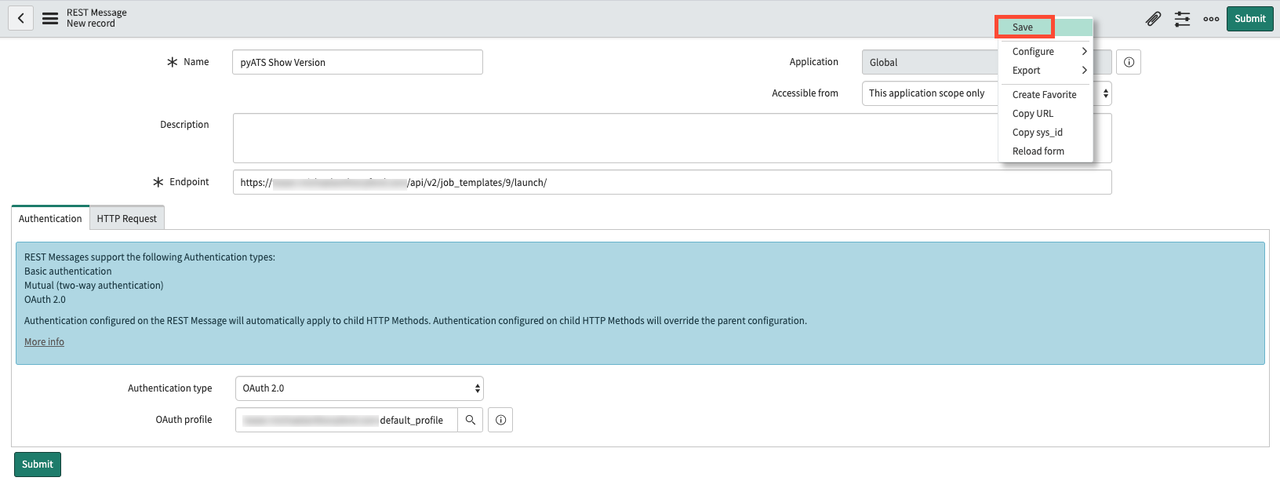
    Right-click inside the grey area at the top; click Save.

    image10-1

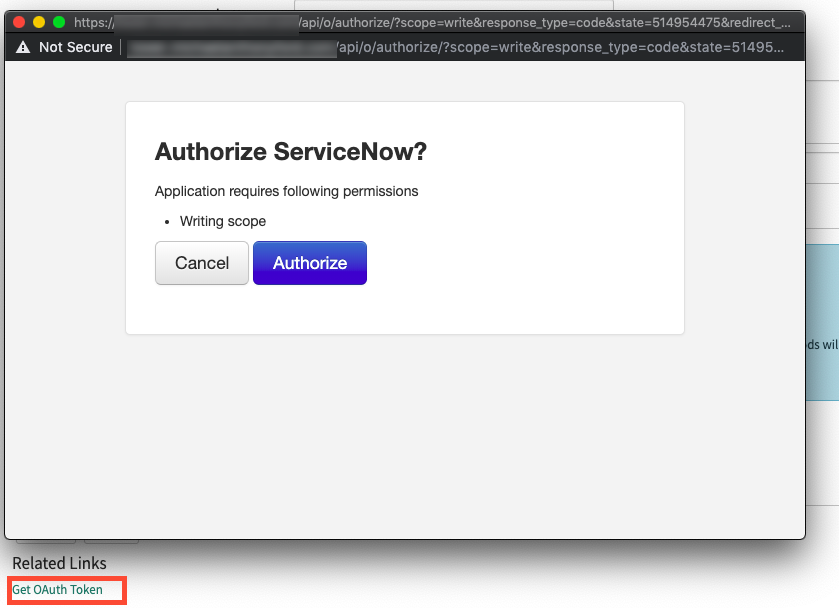
  24. Click the Get Oauth Token button on the REST Message screen. This will generate a pop-up window asking to authorize ServiceNow against your Ansible Tower instance/cluster. Click Authorize. ServiceNow will now have an OAuth2 token to authenticate against your Ansible Tower server.

    image22

  25. Under the HTTP Methods section at the bottom, click the blue New button. At the new dialog window that appears, fill in the following fields:

  26. HTTP Method: POST

  27. Name: Descriptive HTTP Method Name
  28. Endpoint: The url endpoint of the Ansible Tower action you wish to do. This can be taken from the browsable API at https://<tower_url>/api
  29. HTTP Headers (under the HTTP Request tab)
    • The only HTTP Header that should be required is Content-Type: application/json

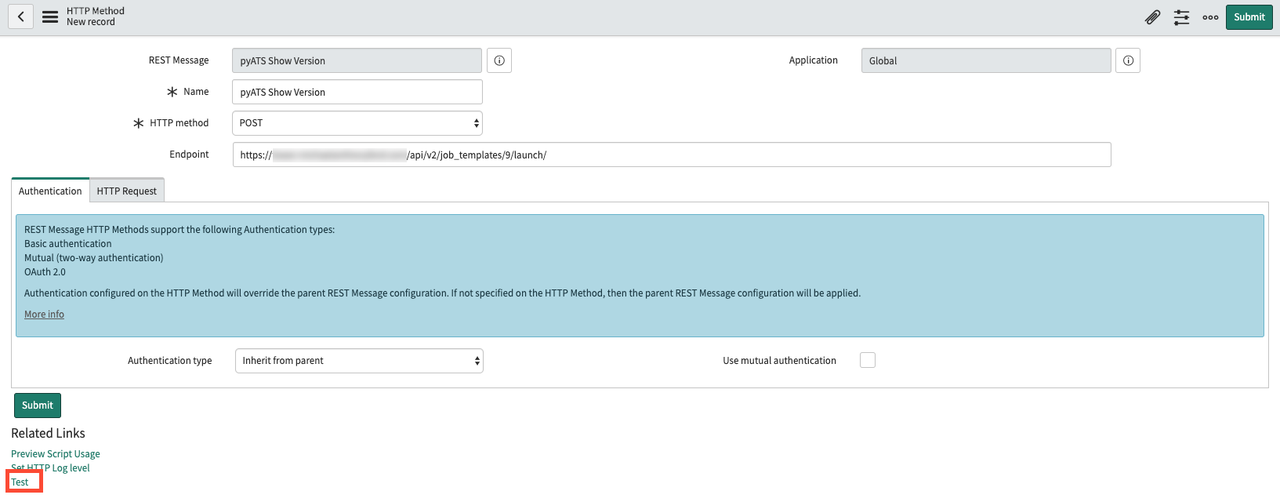
You can kick off a RESTful call to Ansible Tower using these parameters with the Test link.

image6-3

Testing connectivity between ServiceNow and Ansible Tower

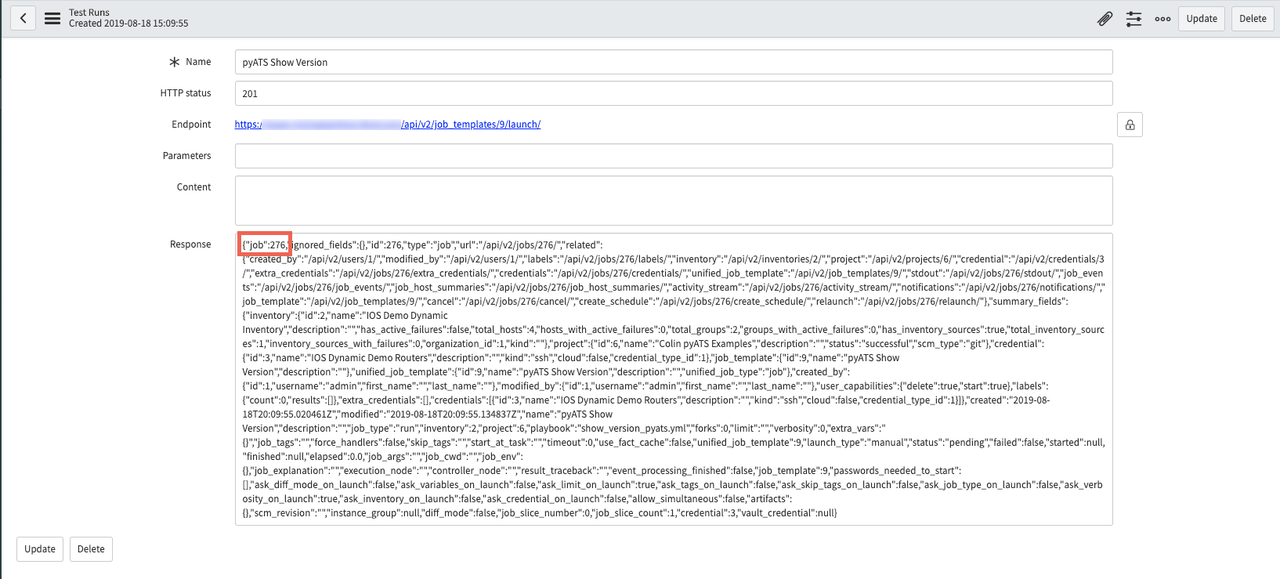
Clicking the Test link will take you to a results screen, which should indicate that the Restful call was sent successfully to Ansible Tower. In this example, ServiceNow kicks off an Ansible Tower job Template, and the response includes the Job ID in Ansible Tower: 276.

image eight

You can confirm that this Job Template was in fact started by going back to Ansible Tower and clicking the Jobs section on the left side of the screen; a Job with the same ID should be in the list (and, depending on the playbook size, may still be in process):

image15

Creating a ServiceNow Catalog Item to Launch an Ansible Tower Job Template

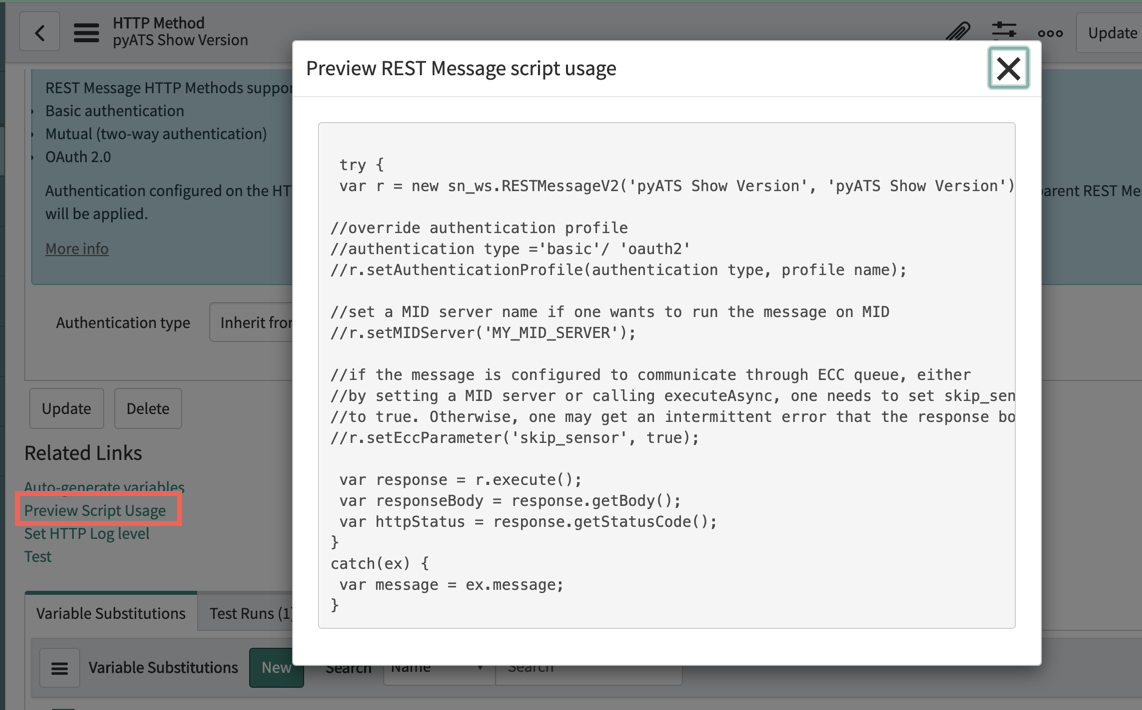
Now that you are able to make outbound RESTful calls from ServiceNow to Ansible Tower, it's time to create a catalog item for users to select in ServiceNow in a production self-service fashion. While in the HTTP Method options, click the Preview Script Usage link:

image nine

Copy the resulting script the appears, and paste it into a text editor to reference later.

  1. In ServiceNow, navigate to Workflow -> Workflow Editor. This will open a new tab with a list of all existing ServiceNow workflows. Click on the blue New Workflow button:

    image16

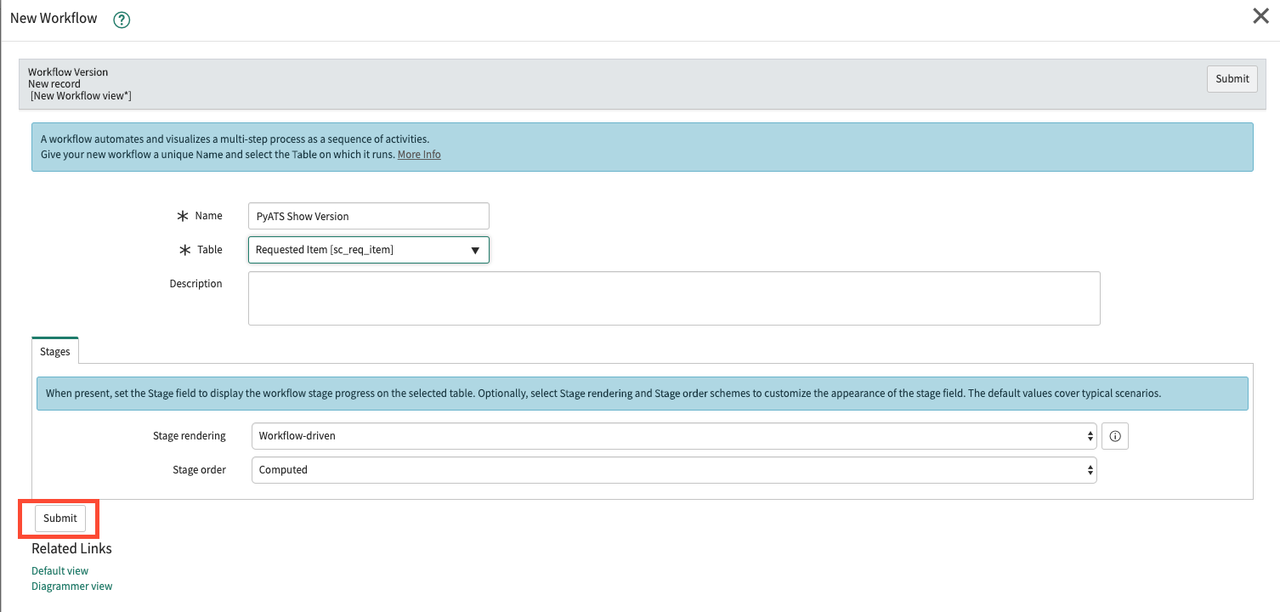
  2. In the New Workflow dialog box that appears, fill in the following options:

  3. Name: A descriptive name of the workflow

  4. Table: Requested Item sc_req_item

    Everything else can be left alone. Click the Submit button.

    image1-10

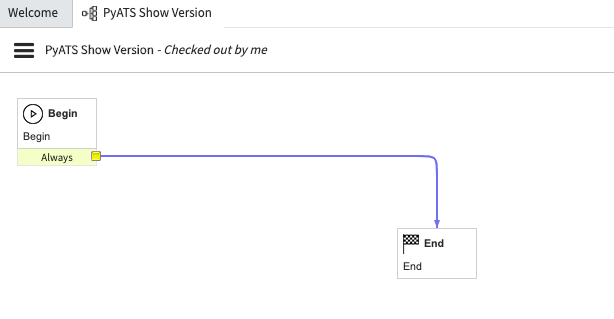
  5. The resulting Workflow Editor will have only a Begin and End box. Click on the line (it will turn blue to indicate it has been selected), then press delete to get rid of it.

    image14-1

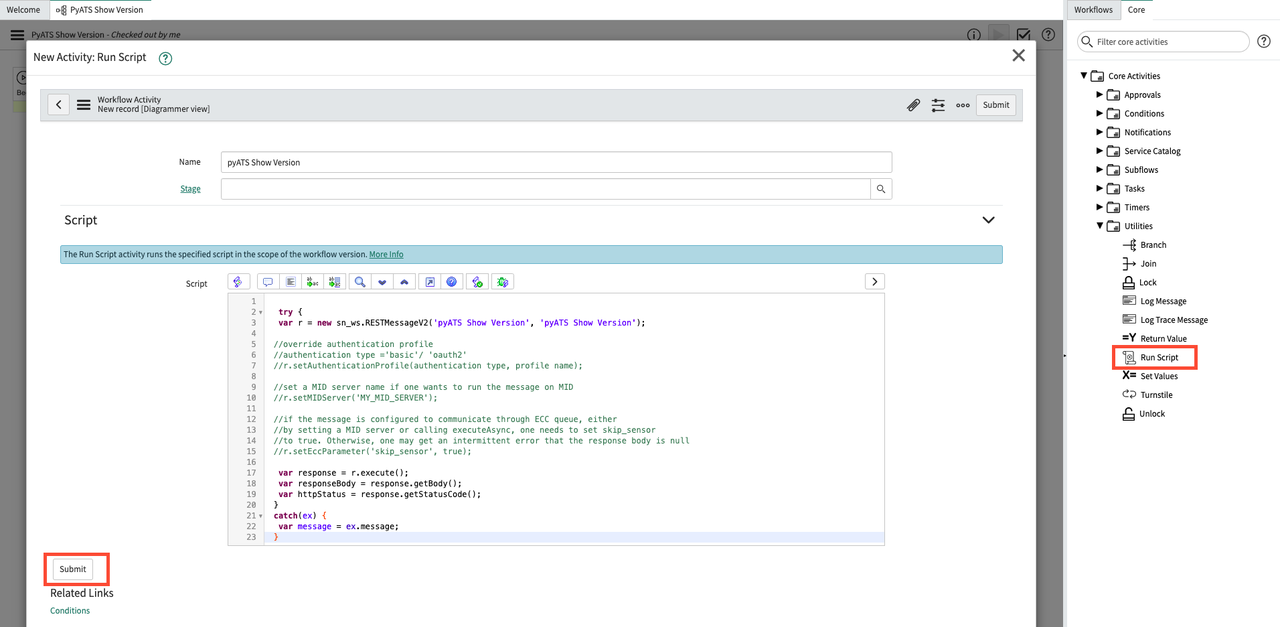
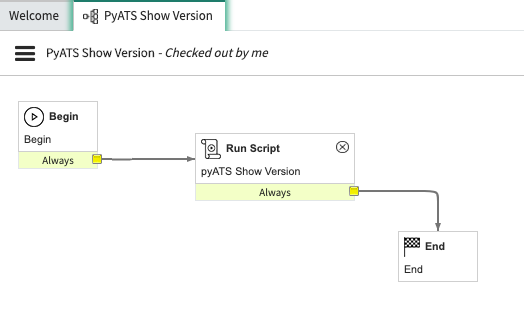
  6. On the right side of the Workflow Editor Screen, select the Core tab and, under Core Activities->Utilities, drag the Run Script option into the Workflow Editor. In the new dialog box that appears, type in a descriptive name, and paste in the script you captured from before. Click Submit to save the Script.

    image12-1

  7. Draw a connection from Begin, to the newly created Run Script Box, and another from the Run Script box to End. Afterward, click on the three horizontal lines to the left of the Workflow name, and select the Publish option. You are now ready to associate this workflow with a catalog item.

    image8-1

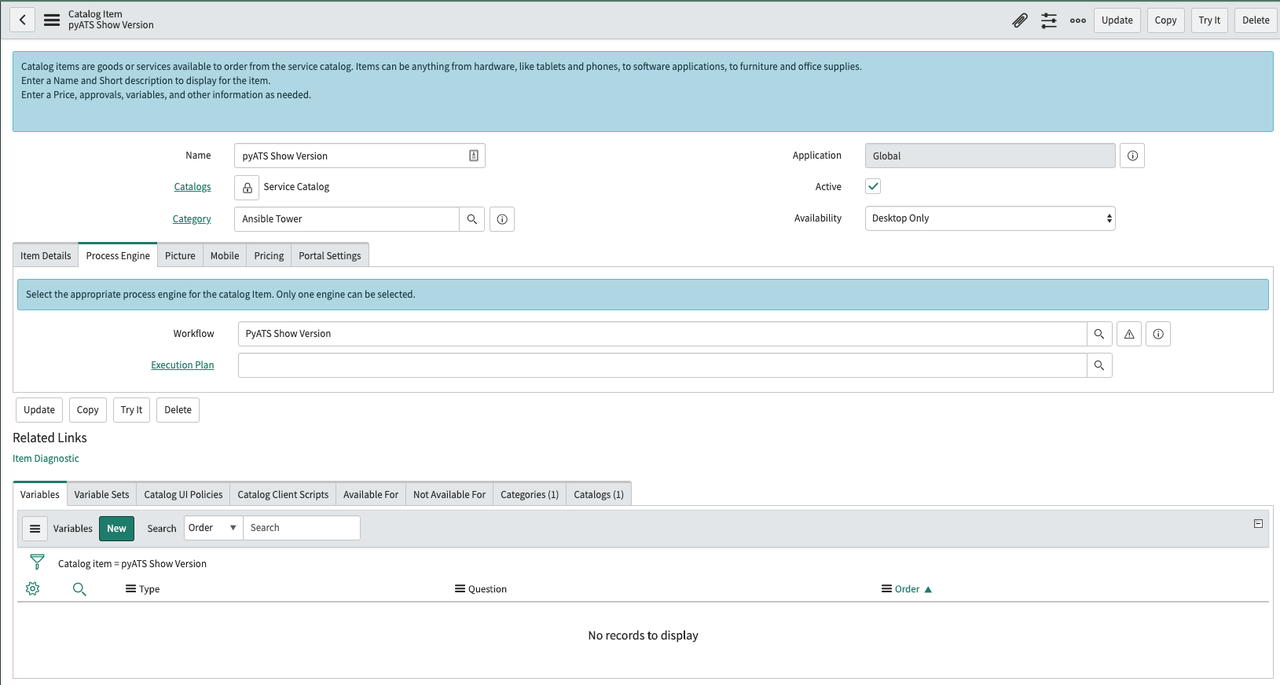
  8. Navigate to Service Catalog -> Catalog Definitions -> Maintain Items. Click the blue New button on the resulting item list. In the resulting dialog box, fill in the following fields:

  9. Name: Descriptive name of the Catalog Item

  10. Catalog: The catalog that this item should be a part of
  11. Category: Required if you wish users to be able to search for this item

    In the Process Engine tab, populate the Workflow field with the Workflow you just created. Click the Submit Button. You've not created a new catalog item!

    image5-4

  12. Lastly, to run this catalog item, navigate to Self-Service -> Homepage and search for the catalog item you just created. Once found, click the order now button. You can see the results page pop up in ServiceNow, and you can confirm that the Job is being run in Ansible Tower.

Congratulations! After completing these steps, you can now use a ServiceNow Catalog Item to launch Job and Workflow Templates in Ansible Tower. This is ideal for allowing end users to use a front end they are familiar with in order to perform automated tasks of varying complexities. This familiarity goes a long way toward reducing the time to value for the enterprise as a whole, rather than just the teams responsible for writing the playbooks being used.


Kubernetes Operators with Ansible Deep Dive, Part 2

Kubernetes Operators with Ansible Deep Dive, Part 2

In part 1 of this series, we looked at operators overall, and what they do in OpenShift/Kubernetes. We peeked at the Operator SDK, and why you'd want to use an Ansible Operator rather than other kinds of operators provided by the SDK. We also explored how Ansible Operators are structured and the relevant files created by the Operator SDK when building Kubernetes Operators with Ansible.

In this the second part of this deep dive series, we'll:

  1. Take a look at creating an OpenShift Project and deploying a Galera Operator.
  2. Next we'll check the MySQL cluster, then setup and test a Galera cluster.
  3. Then we'll test scaling down, disaster recovery, and demonstrate cleaning up.

Creating the project and deploying the operator

We start by creating a new project in OpenShift, which we'll simply call test:

$ oc new-project test --display-name="Testing Ansible Operator"
Now using project "test" on server "https://ec2-xx-yy-zz-1.us-east-2.compute.amazonaws.com:8443"

We won't delve too much into this role, however the basic operation is:

  1. Use set_fact to generate variables using the k8s lookup plugin or other variables defined in defaults/main.yml.
  2. Determine if any corrective action needs to be taken based on the above variables. For example, one variable determines how many Galera node pods are currently running. This is compared against the variable defined on the CustomResource. If they differ, the role will add or remove pods as needed.

To begin the deployment, we have a simple script, which builds the operator image and pushes it to the OpenShift registry for the test project:

$ cat ./create_operator.sh
#!/bin/bash

docker build -t docker-registry-default.router.default.svc.cluster.local/test/galera-ansible-operator:latest .
docker push docker-registry-default.router.default.svc.cluster.local/test/galera-ansible-operator:latest
kubectl create -f deploy/operator.yaml
kubectl create -f deploy/cr.yaml

Before we run this script, we need to first deploy the RBAC rules and custom resource definition for our Galera example:

$ oc create -f deploy/rbac.yaml
clusterrole "galera-ansible-operator" created
clusterrolebinding "default-account-app-operator" created
$ oc create -f deploy/crd.yaml
customresourcedefinition "galeraservices.galera.database.coreos.com" created

Now, we run the script (after using the login command to allow docker to connect to the OpenShift registry we created):

$ docker login -p $(oc whoami -t) -u unused docker-registry-default.router.default.svc.cluster.local
Login Succeeded

$ ./create_operator.sh
Sending build context to Docker daemon 490 kB
...
deployment.apps/galera-ansible-operator created
galeraservice "galera-example" created

In short order, we will see the galera-ansible-operator pod start up, followed by a single pod named galera-node-0001 and a LoadBalancer service which provides our ingress to our Galera cluster:

$ oc get all
NAME DOCKER REPO TAGS UPDATED
is/galera-ansible-operator docker-registry-default.router...:5000/test/galera-ansible-operator latest 3 hours ago

NAME DESIRED CURRENT UP-TO-DATE AVAILABLE AGE
deploy/galera-ansible-operator 1 1 1 1 4m

NAME CLUSTER-IP EXTERNAL-IP PORT(S) AGE
svc/galera-external-loadbalancer 172.30.251.195 172.29.17.210,172.29.17.210 33066:30072/TCP 1m
svc/glusterfs-dynamic-galera-node-0001-mysql-data 172.30.49.250 <none> 1/TCP 1m

NAME DESIRED CURRENT READY AGE
rs/galera-ansible-operator-bc6cd548 1 1 1 4m

NAME READY STATUS RESTARTS AGE
po/galera-ansible-operator-bc6cd548-46b2r 1/1 Running 5 4m
po/galera-node-0001 1/1 Running 0 1m

Verifying the MySQL cluster, initial setup and testing

We can use the describe function to see the status of our custom resource, specifically the size we specified:

$ kubectl describe -f deploy/cr.yaml |grep -i size
Galera _ Cluster _ Size: 1

Now that we have a MySQL cluster, let's test it using sysbench. As mentioned above, we have a system from which to do the testing so we can avoid internet round trips. But first, we'll need some info. We need to know the forwarded port we can connect to through the load balancing service created as part of the operator deployment:

$ oc get services

Next, we need to know the IP of the master. We can get this with oc describe:

$ oc describe node ec2-xx-yy-zz-1.us-east-2.compute.amazonaws.com| grep ^Addresses
Addresses: 10.0.0.46,ec2-xx-yy-zz-1.us-east-2.compute.amazonaws.com

So for this test, we'll be connecting to the IP 10.0.0.46 on port XXXXX. The port value 33066 was specified in the spec above, and is the port which will receive the forwarded traffic. We'll export those to make it a little easier to re-use our test commands.

From the test server:

$ export MYSQL_IP=10.0.0.46
$ export MYSQL_PORT=XXXXX

Before running sysbench, we need to create the database it expects (future versions of the Galera operator will be able to do this automatically):

$ mysql -h $MYSQL_IP --port=$MYSQL_PORT -u root -e 'create database sbtest;'

Next, we'll prepare the test by running sysbench using the OLTP read-only test with a table of 1 million rows:

$ sysbench --db-driver=mysql --threads=150 --mysql-host=${MYSQL_IP} --mysql-port=${MYSQL_PORT} --mysql-user=root --mysql-password= --mysql-ignore-errors=all --table-size=1000000 /usr/share/sysbench/oltp_read_only.lua prepare
sysbench 1.0.9 (using system LuaJIT 2.0.4)
Initializing worker threads...
Creating table 'sbtest1'...
Inserting 1000000 records into 'sbtest1'
Creating a secondary index on 'sbtest1'

...

Note that we use 150 threads here, as a single MySQL/MariaDB instance defaults to this size for its maximum connections allowed.

So now that everything's ready, lets run our first test with sysbench:

$ sysbench --db-driver=mysql --threads=150 --mysql-host=${MYSQL_IP} --mysql-port=${MYSQL_PORT} --mysql-user=root --mysql-password= --mysql-ignore-errors=all /usr/share/sysbench/oltp_read_only.lua run
sysbench 1.0.9 (using system LuaJIT 2.0.4)
Running the test with following options:
Number of threads: 150
Initializing random number generator from current time
Initializing worker threads...
Threads started!
SQL statistics:
    queries performed:
        read:                            174776
        write:                           0
        other:                           24968
        total:                           199744
    transactions:                        12484  (1239.55 per sec.)
    queries:                             199744 (19832.77 per sec.)
    ignored errors:                      0      (0.00 per sec.)
    reconnects:                          0      (0.00 per sec.)
General statistics:
    total time:                          10.0700s
    total number of events:              12484
Latency (ms):
         min:                                  3.82
         avg:                                120.66
         max:                               1028.51
         95th percentile:                    292.60
         sum:                            1506263.71
Threads fairness:
    events (avg/stddev):           83.2267/42.84
    execution time (avg/stddev):   10.0418/0.02

This was just one run, but re-running a few times produces similar results. So our one-node cluster can process about 20K queries/second. But a cluster with only one member isn't very useful - so lets scale it up. We do this by editing the custom resource we defined earlier and changing the galera_cluster_size variable. For now, we'll spin up to a three-node cluster:

$ oc edit -f deploy/cr.yaml
galeraservice.galera.database.coreos.com/galera-example edited

Next, we can verify OpenShift sees this new value:

$ kubectl describe -f deploy/cr.yaml | grep -i size
Galera _ Cluster _ Size: 3

And in short order, we see the Ansible operator receive an event signalling the change and start working to update the cluster:

$ oc get pods
NAME READY STATUS RESTARTS AGE
galera-ansible-operator-bc6cd548-46b2r 1/1 Running 5 30m
galera-node-0001 1/1 Running 0 26m
galera-node-0002 0/1 Running 0 1m
galera-node-0003 0/1 Running 0 56s

And after about a minute (each Galera node has to start and sync data from another member), we see the new pods become ready:

$ oc get pods
NAME READY STATUS RESTARTS AGE
galera-ansible-operator-bc6cd548-46b2r 1/1 Running 5 31m
galera-node-0001 1/1 Running 0 27m
galera-node-0002 1/1 Running 0 2m
galera-node-0003 1/1 Running 0 2m

Now that we have a three node cluster, we can re-run the same test as earlier:

$ sysbench --db-driver=mysql --threads=150 --mysql-host=${MYSQL_IP} --mysql-port=${MYSQL_PORT} --mysql-user=root --mysql-password= --mysql-ignore-errors=all /usr/share/sysbench/oltp_read_only.lua run
sysbench 1.0.9 (using system LuaJIT 2.0.4)
Running the test with following options:
Number of threads: 150
Initializing random number generator from current time
Initializing worker threads...
Threads started!
SQL statistics:
    queries performed:
        read:                            527282
        write:                           0
        other:                           75326
        total:                           602608
    transactions:                        37663  (3756.49 per sec.)
    queries:                             602608 (60103.86 per sec.)
    ignored errors:                      0      (0.00 per sec.)
    reconnects:                          0      (0.00 per sec.)
General statistics:
    total time:                          10.0247s
    total number of events:              37663
Latency (ms):
         min:                                  4.30
         avg:                                 39.88
         max:                               8371.55
         95th percentile:                     82.96
         sum:                            1501845.63
Threads fairness:
    events (avg/stddev):           251.0867/87.82
    execution time (avg/stddev):   10.0123/0.01

With dramatic results! Our cluster is now able to process 60K queries per second! How far can we take this? Well, if you noticed our node count at the start we have five nodes in our k8s cluster, so lets make our Galera cluster match that:

$ oc edit -f deploy/cr.yaml
galeraservice.galera.database.coreos.com/galera-example edited
$ kubectl describe -f deploy/cr.yaml | grep -i size
Galera _ Cluster _ Size: 5

The Ansible operator starts growing the Galera cluster...:

$ oc get pods
NAME READY STATUS RESTARTS AGE
galera-ansible-operator-bc6cd548-46b2r 1/1 Running 5 35m
galera-node-0001 1/1 Running 0 32m
galera-node-0002 1/1 Running 0 7m
galera-node-0003 1/1 Running 0 7m
galera-node-0004 0/1 Running 0 38s
galera-node-0005 0/1 Running 0 34s

And again after about a minute or so we have a Galera cluster with five pods ready to serve queries:

$ oc get pods
NAME READY STATUS RESTARTS AGE
galera-ansible-operator-bc6cd548-46b2r 1/1 Running 5 36m
galera-node-0001 1/1 Running 0 33m
galera-node-0002 1/1 Running 0 8m
galera-node-0003 1/1 Running 0 8m
galera-node-0004 1/1 Running 0 1m
galera-node-0005 1/1 Running 1 1m

Oddly, the fifth node had a problem, but OpenShift retried it after it failed and it came up and into the cluster. Great!

So let's rerun our same test once again:

$ sysbench --db-driver=mysql --threads=150 --mysql-host=${MYSQL_IP} --mysql-port=${MYSQL_PORT} --mysql-user=root --mysql-password= --mysql-ignore-errors=all /usr/share/sysbench/oltp_read_only.lua run
sysbench 1.0.9 (using system LuaJIT 2.0.4)
Running the test with following options:
Number of threads: 150
Initializing random number generator from current time
Initializing worker threads...
Threads started!
SQL statistics:
queries performed:
        read:                            869260
        write:                           0
        other:                           124180
        total:                           993440
    transactions:                        62090  (6196.82 per sec.)
    queries:                             993440 (99149.17 per sec.)
    ignored errors:                      0      (0.00 per sec.)
    reconnects:                          0      (0.00 per sec.)
General statistics:
    total time:                          10.0183s
    total number of events:              62090
Latency (ms):
         min:                                  5.41
         avg:                                 24.18
         max:                                159.70
         95th percentile:                     46.63
         sum:                            1501042.93
Threads fairness:
    events (avg/stddev):           413.9333/78.17
    execution time (avg/stddev):   10.0070/0.00

And we're hitting 100K queries per second. Our cluster has thus-far scaled linearly with the number of nodes we've spun up. At this point, we've maxed out the resources of our OpenShift cluster, and spinning up more Galera nodes doesn't help:

$ oc edit -f deploy/cr.yaml
galeraservice.galera.database.coreos.com/galera-example edited
$ kubectl describe -f deploy/cr.yaml | grep -i size
Galera _ Cluster _ Size: 9

$ oc get pods
NAME READY STATUS RESTARTS AGE
galera-ansible-operator-bc6cd548-46b2r 1/1 Running 5 44m
galera-node-0001 1/1 Running 0 41m
galera-node-0002 1/1 Running 0 16m
galera-node-0003 1/1 Running 0 16m
galera-node-0004 1/1 Running 0 9m
galera-node-0005 1/1 Running 1 9m
galera-node-0006 1/1 Running 0 1m
galera-node-0007 1/1 Running 0 1m
galera-node-0008 1/1 Running 0 1m
galera-node-0009 1/1 Running 0 1m

$ sysbench --db-driver=mysql --threads=150 --mysql-host=${MYSQL_IP} --mysql-port=${MYSQL_PORT} --mysql-user=root --mysql-password= --mysql-ignore-errors=all /usr/share/sysbench/oltp_read_only.lua run
sysbench 1.0.9 (using system LuaJIT 2.0.4)
Running the test with following options:
Number of threads: 150
Initializing random number generator from current time
Initializing worker threads...
Threads started!
SQL statistics:
    queries performed:
        read:                            841260
        write:                           0
        other:                           120180
        total:                           961440
    transactions:                        60090  (5995.71 per sec.)
    queries:                             961440 (95931.35 per sec.)
    ignored errors:                      0      (0.00 per sec.)
    reconnects:                          0      (0.00 per sec.)
General statistics:
    total time:                          10.0208s
    total number of events:              60090
Latency (ms):
         min:                                  5.24
         avg:                                 24.98
         max:                                192.46
         95th percentile:                     57.87
         sum:                            1501266.08
Threads fairness:
    events (avg/stddev):           400.6000/134.04
    execution time (avg/stddev):   10.0084/0.01

Performance actually decreased a bit! This shows that MySQL/MariaDB are pretty resource-intensive, so if you want to continue scaling out the performance you may need to add more OpenShift cluster resources. But at this point, our cluster is serving nearly 5x the traffic as when we originally started it up. Continued tuning of MySQL/MariaDB and Galera could extend that and allow us to increase performance further. However the goal here was to show how to create an Ansible operator to control a very complex, data-oriented application.

Scaling the cluster down

Since those extra nodes aren't helping out (other than providing a bit more redundancy in the event of a failure), lets scale the cluster back down to five nodes:

$ oc edit -f deploy/cr.yaml
galeraservice.galera.database.coreos.com/galera-example edited
$ kubectl describe -f deploy/cr.yaml | grep -i size
Galera _ Cluster _ Size: 5

After a short while, we see the operator begin to terminate pods that are no longer required:

$ oc get pods
NAME READY STATUS RESTARTS AGE
galera-ansible-operator-bc6cd548-46b2r 1/1 Running 5 46m
galera-node-0001 1/1 Running 0 43m
galera-node-0002 1/1 Running 0 18m
galera-node-0003 1/1 Running 0 18m
galera-node-0004 1/1 Running 0 11m
galera-node-0005 1/1 Running 1 11m
galera-node-0006 0/1 Terminating 0 3m
galera-node-0007 0/1 Terminating 0 3m
galera-node-0008 0/1 Terminating 0 3m
galera-node-0009 0/1 Terminating 0 3m

Disaster recovery

Now, let's add some chaos. Looking at our first worker xx-yy-zz-2, we can see which pods are running on the node:

$ oc describe node ec2-xx-yy-zz-2.us-east-2.compute.amazonaws.com
...
Non-terminated Pods: (5 in total)
Namespace Name CPU Requests CPU Limits Memory Requests Memory Limits
--------- ---- ------------ ---------- --------------- -------------
openshift-monitoring node-exporter-bqnzv 10m (0%) 20m (1%) 20Mi (0%) 40Mi (0%)
openshift-node sync-hjtmj 0 (0%) 0 (0%) 0 (0%) 0 (0%)
openshift-sdn ovs-55hw4 100m (5%) 200m (10%) 300Mi (4%) 400Mi (5%)
openshift-sdn sdn-rd7kp 100m (5%) 0 (0%) 200Mi (2%) 0 (0%)
test galera-node-0004 0 (0%) 0 (0%) 0 (0%) 0 (0%)
...

So galera-node-0004 is running here, along with some other infrastructure bits. Lets restart it from the AWS EC2 console and see what happens...

$ oc get nodes
NAME STATUS AGE
ec2-xx-yy-zz-1.us-east-2.compute.amazonaws.com Ready 1d
ec2-xx-yy-zz-2.us-east-2.compute.amazonaws.com NotReady 1d
ec2-xx-yy-zz-3.us-east-2.compute.amazonaws.com Ready 1d
ec2-xx-yy-zz-4.us-east-2.compute.amazonaws.com Ready 1d
ec2-xx-yy-zz-5.us-east-2.compute.amazonaws.com Ready 1d
ec2-xx-yy-zz-6.us-east-2.compute.amazonaws.com Ready 1d
ec2-xx-yy-zz-7.us-east-2.compute.amazonaws.com Ready 1d
ec2-xx-yy-zz-8.us-east-2.compute.amazonaws.com Ready 1d

Eventually, we see galera-node-0004 enter an unknown state:

$ oc get pods
NAME READY STATUS RESTARTS AGE
galera-ansible-operator-bc6cd548-46b2r 1/1 Running 5 50m
galera-node-0001 1/1 Running 0 47m
galera-node-0002 1/1 Running 0 22m
galera-node-0003 1/1 Running 0 22m
galera-node-0004 1/1 Unknown 0 16m
galera-node-0005 1/1 Running 1 16m

And in a while the pod will be terminated, after which the Ansible operator will restart it:

$ oc get pods
NAME READY STATUS RESTARTS AGE
galera-ansible-operator-bc6cd548-46b2r 1/1 Running 5 55m
galera-node-0001 1/1 Running 0 52m
galera-node-0002 1/1 Running 0 27m
galera-node-0003 1/1 Running 0 27m
galera-node-0004 1/1 Running 1 1m
galera-node-0005 1/1 Running 1 21m

... and our cluster is back to its requested capacity!

Cleanup

Since this is a test we'll want to clean up after ourselves. When we're done we use the delete_operator.sh script to remove the custom resource and the operator deployment:

$ ./delete_operator.sh
galeraservice.galera.database.coreos.com "galera-example" deleted
deployment.apps "galera-ansible-operator" deleted

In a couple of minutes, everything is gone:

$ oc get all
NAME DOCKER REPO TAGS UPDATED
is/galera-ansible-operator docker-registry-default.router...:5000/test/galera-ansible-operator latest 4 hours ago

Summary

The Galera operator is a work in progress and is most definitely not ready for production. If you'd like to view the playbooks themselves, you can see the code here:

https://github.com/water-hole/galera-ansible-operator

We're going to be continuing development on this with the goal of making it the de facto example for other data storage applications. Thanks for reading!


Kubernetes Operators with Ansible Deep Dive, Part 1

Kubernetes Operators with Ansible Deep Dive, Part 1

This deep dive series assumes the reader has access to a Kubernetes test environment. A tool like minikube is an acceptable platform for the purposes of this article. If you are an existing Red Hat customer, another option is spinning up an OpenShift cluster through cloud.redhat.com. This SaaS portal makes trying OpenShift a turnkey operation.

In this part of this deep dive series, we'll:

  1. Take a look at operators overall, and what they do in OpenShift/Kubernetes.
  2. Take a quick look at the Operator SDK, and why you'd want to use an Ansible operator rather than other kinds of operators provided by the SDK.
  3. And finally, how Ansible Operators are structured and the relevant files created by the Operator SDK.

What Are Operators?

For those who may not be very familiar with Kubernetes, it is, in its most simplistic description - a resource manager. Users specify how much of a given resource they want and Kubernetes manages those resources to achieve the state the user specified. These resources can be pods (which contain one or more containers), persistent volumes, or even custom resources defined by users.

This makes Kubernetes useful for managing resources that don't contain any state (like pods of web servers or load balancing resources). However, Kubernetes doesn't provide any built-in logic for managing resources like databases or caches which are stateful and sensitive to restarts. Operators were created to bridge this gap by providing a way for users to specify a piece of code (traditionally written in Golang) tied to custom resource definitions in Kubernetes.

Operators were so named because they allow you to embed your operational logic of an application into an automated manager running on Kubernetes/OpenShift.

The Operator SDK, and a quick overview of Ansible Operators

Red Hat created the Operator Framework to make the job of creating and managing operators easier across their full lifetime. As part of the framework, the Operator SDK is tasked with creating and building operators in an automated manner for users. Over time it has grown to add several operator types. In 2018, we began work on adding the Ansible Operator type to the SDK. We want to make it easier to build operators in Kubernetes environments based on Ansible.

Why use Ansible for Operators?

At first, operators were written in Golang. This immediately sets the bar somewhat high for anyone who wants to write an operator --- someone has to know a relatively low-level programming language to get started. On top of this, you must also be familiar with Kubernetes internals, such as the API and how events are generated for resources.

The Ansible Operator was created to address this short-coming. The Ansible Operator consists of two main pieces:

  1. A small chunk of Golang code, which handles the interface between Kubernetes/OpenShift and the operator.
  2. A container, which receives events from the above code and runs Ansible Playbooks as required.

That's it! The Ansible and Operator SDK abstract away all of the difficult parts of writing an operator and allows you to focus on what matters --- managing your applications. If you already have a large base of Ansible knowledge in your organization, you can immediately begin managing applications using Ansible Operator. A further added bonus of using Ansible for your operators is that you immediately have access to any module that Ansible can run. This allows folks to incorporate off-cluster management tasks related to your application. For example:

  1. Creating DNS entries for your newly deployed applications
  2. Spinning up resources external to your cluster, such as storage or networking
  3. More easily do off-site backups to external cloud services
  4. Manage external load balancing based on custom metrics

There are a number of possibilities that Kubernetes Operators written with Ansible can provide a potential solution for.

Creating a Kubernetes Operator with Ansible from scratch

First, install the Operator SDK following their instructions. Once the install is complete, we can create a new operator with the following command:

$ operator-sdk new test-operator \
    --api-version=test.ansible-operator.com/v1 \
    --kind=Test \
    --type=ansible

INFO[0000] Creating new Ansible operator 'test-operator'.
...
INFO[0000] Project creation complete.

$ cd test-operator/

Kubernetes Operator with Ansible structure and files

[Now that we have our Operator skeleton, let's take a look at some of the main files used when deploying Operators in general, as well as what the Ansible Operator type generated specifically. These are the:

  1. watches.yaml file.
  2. build directory.
  3. deploy directory.
  4. roles directory.

One other directory is present here as well: the molecule directory, which contains files to automate testing your roles/playbooks using Molecule. We will not be covering the use of Molecule here it's noted for the sake of being complete.

If you run ls -l in the above test-operator directory, you see these files/directories there after creating the new operator skeleton.

The watches.yaml file

This file is used by the Ansible Operator to tell Kubernetes/OpenShift which custom resources (based on the Group/Version/Kind fields) the operator is responsible in handling. It is the glue that ties our custom code to the Kubernetes API:

---
- version: v1
  group: test.ansible-operator.com
  kind: Test
  role: /opt/ansible/roles/test

specifying any other playbook boilerplate. However if you are running more than one role in your operator you can change that line to be:

playbook: /opt/ansible/playbook.yaml

Also, you'll need to tweak the build/Dockerfile (more on this below) to copy the playbook into the container so add this line:

COPY playbook.yaml ${HOME}/playbook.yaml

You would then create the specified playbook in the same directory as the watches.yaml file.

The build directory

This directory contains a few files related to building the operator artifact. Because operators are just another application to OpenShift/Kubernetes, this artifact is a container built using a Dockerfile. The other files here are related to testing via Molecule, which we are not going to cover in this blog series.

The Dockerfile is very simple, so we won't delve into it much other than to say it is based on the ansible-operator image from quay.io, and copies the roles and watches.yml file into the container image.

The deploy directory

This directory contains YAML files for deploying the operator into OpenShift/K8s using the oc CLI commands.

The CustomResourceDefinition (CRD) and CustomResource (CR) are defined in the deploy/crds/ directory. The CRD is what the watches.yaml file references, meaning all instances (CRs) of this definition will be controlled by our operator.

The CRD is defined in deploy/crds/test_v1_test_crd.yaml and is mostly boilerplate for OpenShift/Kubernetes:

apiVersion: apiextensions.k8s.io/v1beta1
kind: CustomResourceDefinition
metadata:
  name: tests.test.ansible-operator.com
spec:
  ...

You can see the operator-sdk command above filled in most of these fields with the values we specified. By themselves, CRDs are not very useful, you need actual instances of what they define --- this is what CustomResources do. Our CustomResource (CR) is defined in deploy/crds/test_v1_test_cr.yaml, and is relatively short (compared to the other YAML files, anyway):

apiVersion: test.ansible-operator.com/v1
kind: Test
metadata:
  name: example-test
spec:
  size: 3

Each of the values set under the spec entry become variables passed into Ansible as extra variables. Using these, we can customize the behavior of our operator. The default example creates an entry named size, which we can use in our roles to dynamically scale the application our operator is managing.

The deploy/role.yaml and deploy/role_binding.yaml (not shown), define some RBAC controls which give your login access to manage the custom resources defined above. Role Based Access Control (RBAC) is not covered in this post, so again we're just mentioning them for completeness.

Finally, the deploy/operator.yaml:

apiVersion: apps/v1
kind: Deployment
metadata:
  name: test-operator
spec:
  ...

This file is quite long, but mainly it creates a new Deployment resource in OpenShift/Kubernetes, which helps ensure that our operator stays up and running.

The roles directory

This is the directory where you place any roles you wish to include with your operator, and should be familiar to experienced Ansible users. As noted above, this directory is copied completely into the Ansible Operator container, and roles here can be referenced in the watches.yaml file or other playbooks you include.

Roles commonly use the k8s module (included in Red Hat Ansible Automation since the 2.6 release) to manage resources on the cluster. If you are familiar with Kubernetes resource files, this module will be very intuitive (the YAML from a resource file can be copy/pasted directly as the input to this module). To learn more, you can read the documentation for the k8s module here:

https://docs.ansible.com/ansible/latest/modules/k8s_module.html

Summary

This concludes our deep dive into operators, Operator SDK, and Ansible Operator creation and structure. Operators written using Ansible give you the power of operators in general, while allowing you to leverage preexisting Ansible expertise to quickly get up to speed on deploying applications on OpenShift or Kubernetes.


The Future of Ansible Content Delivery

The Future of Ansible Content Delivery

Everyday, I'm in awe of what Ansible has grown to be. The incredible growth of the community and viral adoption of the technology has resulted in a content management challenge for the project.

I don't want to echo a lot of what's been said by our dear friend Jan-Piet Mens or our incredible Community team, but give me a moment to take a shot at it.

Our main challenge is rooted in the ability to scale. The volume of pull requests and issues we see day to day severely outweigh the ability of the Ansible community to keep up with that rate of change.

As a result, we are embarking on a journey. This journey is one that we know that the community, both our content creators and content consumers, will be interested in hearing about.

This New World Order (tongue in cheek), as we've been calling it, is a model that will allow for us to empower the community of contributors of Ansible content (read: modules, plugins, and roles) to provide their content at their own pace.

To do this, we have made some changes to how Ansible leverages content that is not "shipped" with it. In short, Ansible content will not have to be a part of a milestone Core release of the Engine itself. We will be leveraging a delivery process and content structure/format that helps alleviate a lot of the ambiguity and pain that is currently there due to tying plugins to the Core Engine.

The cornerstone of this journey is something you may have heard rumblings of out in the interwebs. This thing is called a Ansible Content Collection, or Collection(s), for short.

To create Ansible Content Collections, we took a look at a lot of things already in practice. We looked at other tools, other packaging formats, delivery engines, repositories, and ultimately, ourselves. In all of that investigation we feel we have come up with a pretty sound spec. Below we cover some details of that.

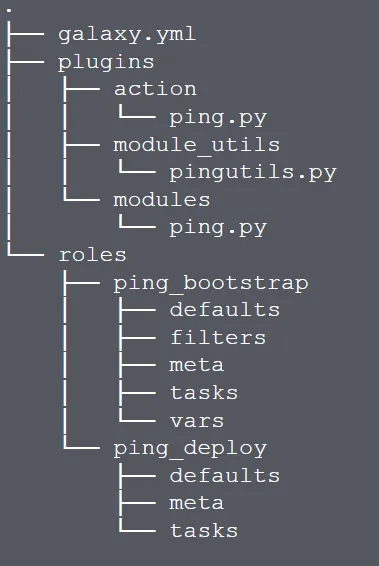
A Collection is a strict project/directory structure for Ansible Content. Similar to the role directory structure; we are now highlighting what is important to Ansible Playbook execution. Here's a graphic of that spec, created by my teammate, Tim Appnel.

Screenshot_future-of-content-1

As you can see, this structure does look very similar to roles. There are some slight differences though. Notice that the roles directory no longer contains a library folder? The idea here is that a Collection itself is the true encapsulation of every piece of content relevant to it, and the playbook that is executing that content. So we've taken the libraries out of the various roles that could live in a collection, and placed them at the top level in the plugins directory. There, all types of plugins (yes modules are there because modules are actually plugins) will be usable by the roles and ultimately all playbooks that could potentially call them. Because this content will be "installed" in a location that the Engine is aware of, and will know to look for content that is being called in the playbook.

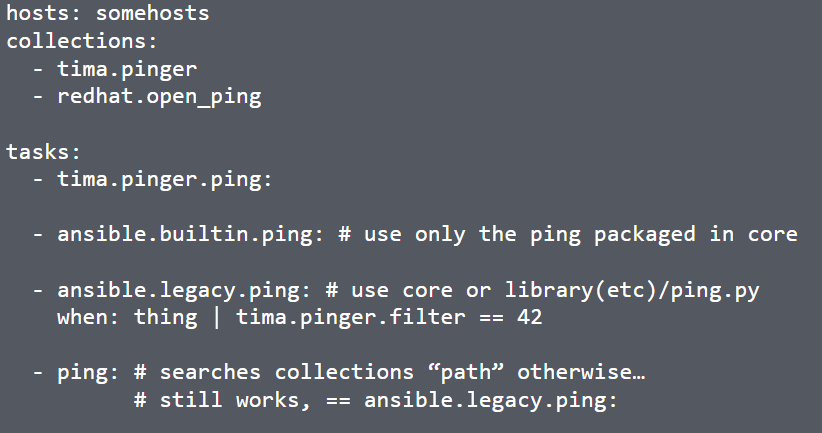
Also, with these changes, we have introduced some namespacing concepts into playbooks as well. Here's another graphic, by Tim, that is a snippet out of a playbook that highlights that namespacing.

Screenshot_future-of-content-2

So what we've got here is a very simple playbook. In this playbook we have highlighted the list of Collections that we're interested in using. For each task, we are using the FQCN (Fully Qualified Collection Namespace) path to the module. Of course, we still want to make this simple. So playbook creators won't have to always fully qualify their content path. As you see in the fourth task, creators can still use the shorthand name of a module. Ansible will search the path of collections in a first come first serve approach, as defined in Ansible configuration or within the play itself.

That's about all I've got for going into Collections.

Happy Automating folks!